Inspector…no, I do not really mean the Scotland Yard type, but rather a code inspector. Today’s modern browsers all have built in inspectors. As a web developer, it is crucial that this be a part of your toolbox. In fact, they have become so common place that many forums have the expectation that you have already inspected your code prior to asking the question.
So what are they? How do they work? Well, since I do not want this post to become a dissertation, I will focus on a single browser, Chrome. It has become my personal favorite over the years as I find the ease of use intuitive for me. That does not disparage the other browsers. You may appreciate one of the other ones out there more so than Chrome. That is fine. The topics I will cover exist in all modern browsers, they just might have a slightly different interface of shortcut to get to them, etc. So let’s dive into some of the inspector tabs and tools…
Opening the Inspector
These may differ between browsers, but typically there are various ways to get to the inspector…
- Through the file menu (or pancake menu in the case of Chrome). Then it is typically called ‘Developer Tools’ or the like.
- Right-clicking a page and selecting ‘Inspect Element’. This has the advantage of not only opening the inspector, but taking you to the position in the code where the element you clicked upon exists.
- Shortcut keys…
- F12 – opens up the inspector on the console tab…so does CTRL-Shift-J
- CTRL-Shift-I – opens the inspector on the elements tab
Inspector Opened…so now what?
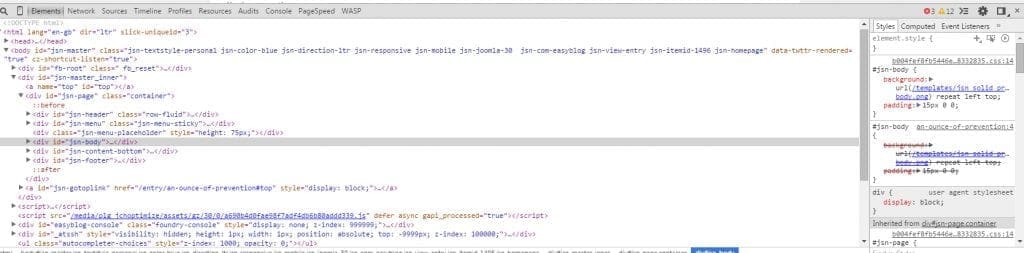
Elements Tab
The elements tab displays your HTML. It is interactive in that you can expand or contract elements. You can add, delete or alter attributes. This is not permanent…just in your view. You have to still alter the original file. The main screen will highlight the elements in the page as you scroll over them so you can visually see where you are on the page.
There is also a CSS listing on this tab. You can add, remove or alter css rules here to see the effects. You can even see how the css rules are computed for inheritance. You can also look at pseudo classes, such as hover.

Network Tab
The network tab is where you will find each network request. Every item on the page is displayed and shows how it was retrieved, how long it took and more. I find this tab invaluable for two major aspects…performance and Ajax functionality.
Performance…if I find my app is not performing how I like, I can see how long each request took and then take action on the offender, since I will know which request(s) took the longest.
Ajax…I can watch each Ajax request and even click on it to see the server response. This is especially helpful in debugging Ajax.

Sources Tab
I utilize the sources tab for a lot of JavaScript debugging. It is on this tab where you can set break point (even conditional ones). You can implement watch expressions and see your variables change throughout your program’s lifespan.

Console Tab
The console tab is another one I use constantly. This screen displays any errors or warnings that the program produces. So I also utilize this tab while debugging. Additionally, you can write JavaScript code directly into the console and have the Chrome V8 JavaScript engine interpret it. Plus, you can write to the console from your JavaScript code with the console.log method. The more you develop, the more you will utilize this tab.

So there you have it…a few of the items at your disposal within the inspector. Now, I have just scratched the surface. There is a lot more to the inspector, such as a mobile emulator, add-ons that can be added to the inspector and more. I would encourage you to make use of it extensively and get to know the tools. You will find it saves you a lot of time and headache when coding and debugging.
Happy Coding!
Clay Hess